Optimization of the Microstructure of Ledeburitic Tool Steels: a Fractal Approach
L. Mishnaevsky Jr 13.01.2000 Werkstoffkolloquium (MPA, University of Stuttgart)
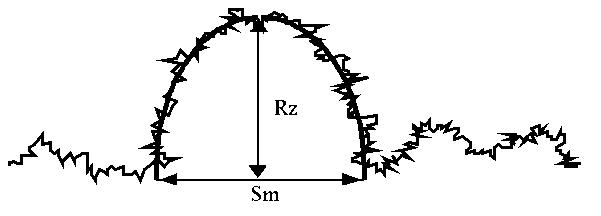
Simple Geometrical Model for Determining a Relationship between the Fractal Dimension of a Crack and Surface Roughness
Appearance of a Peak on the Fracture Surface
Determination of the Fractal Dimension of a Crack: by equating the real length L of this part of the surface profile, which is calculated with the use of the classical integral equation for the length of a curve, to that, calculated with the use of the fractal model, one obtains:
D = 1 + ln (k)/[ln Sm – ln d]
The fractal dimension of a fracture surface increases with increasing the roughness of fracture surface.
Surface Roughness of Fracture Surface, Fractal Dimension of Crack and Fracture Toughness: Interrelations.
G = G0 (d/L0)1-D,
where
d - yardstick length (here - carbide size), L0 - nominal crack size, G0 - value of G for ordinary, non-fractal crack.
KIc ~ (Rz/Sm+1)0.5 B ln(d/Lo)
where B - material parameter.
=> Fracture toughness
of steels increases with increasing the width of crack path (or with increasing the height of the fracture surface).|
- Experimental equation obtained by Lippmann (Ph.D. Dissertation, 1995) for high speed steel S6-5-2
|
KIc ~ ln (Rz) |
|
- Results of Berns et al., Eng. Fract. Mech., Vol. 58, No. 4, 1997
|
"...a high crack deflection corresponds to a high fracture toughness..." |
Probabilistic Model of Crack Growth in Netlike Structures of Steels
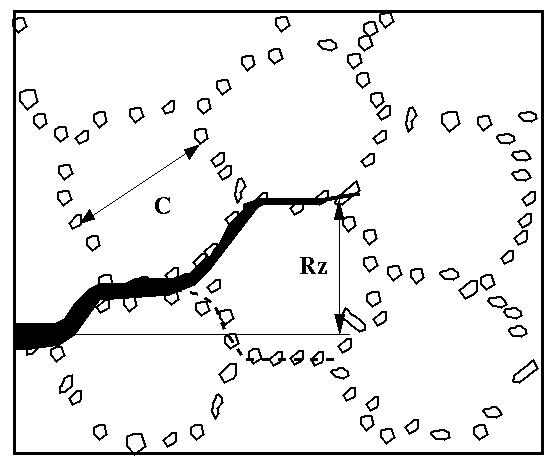
Prob{Rz} ~ 0.5Rz/C
where C - diameter of unit cell in the netlike structure.
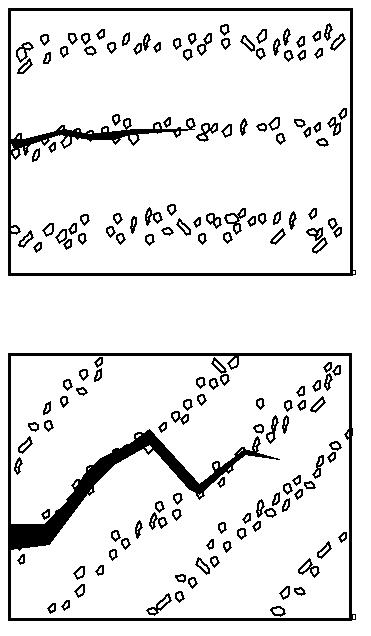
Crack Growth in Bandlike Structures of Steels
|
1st case: Crack parallel to bands 2nd case:Crack at an angle with bands |
 |
Conclusions from the Analysis of the Fractality of Fracture in Different Steel Structures
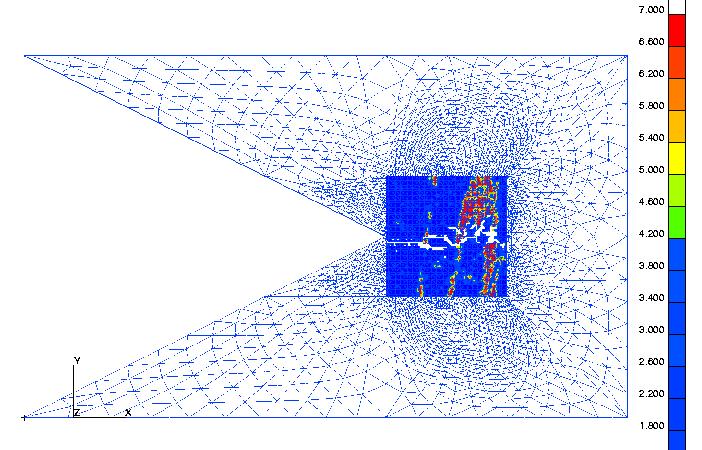
Micromechanical Simulation of Crack Growth in Real Structures of Steels
Crack Growth in Real Microstructure of High Speed Steel
Input Data for the Simulation of Fracture in Real and Idealized Structures
(for cold work steel)
E Matrix = 232 GPa,
E Carbide = 276 GPa.
|
Cold work steel |
sigmay = 1195 +1390 [1-exp (-epsilonpl/0.0099)]
|
|
High speed steel |
sigmay = 1500 +1101 [1-exp(-epsilonpl/0.00369)] |
Plastic strain ~ 0.1 %
Transition from Macromodel of Short-Rod Specimen to the Micromodel
Uymicro = 0.0002 * (Number of increments) * (-1.96 X +1),
where
X = x-coordinate of the point.
Conclusions from the Micromechanical FE-Simulation of Crack Growth in Real Structure
"...running crack must follow carbide bands...The width of the crack is restricted to jumps between adjacent carbide bands, but most of the crack surface is produced by cleavage of carbides in one band" (Berns et al., Eng. Fract. Mech., Vol. 58, No. 4, 1997)
Micromechanical Simulation of Crack Growth in Idealized Artificial Microstructures of the Steels
Main points:
Idealized Quasi-Realistic Microstructures of Steels used in the Simulations
 |
 |
 |
 |
 |
 |
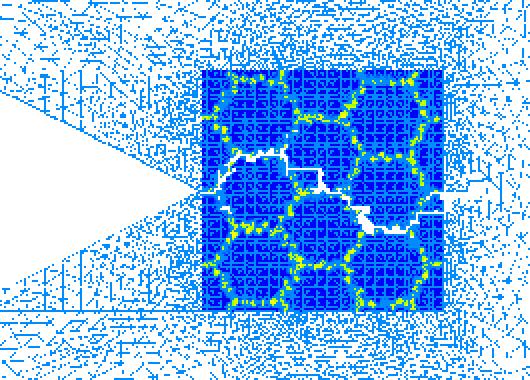
Crack Growth in Netlike Fine Microstructure
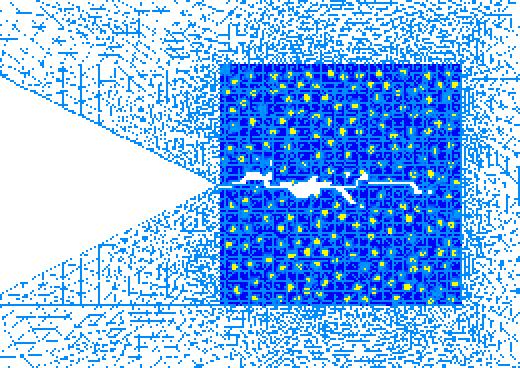
Crack Growth in Random Fine Microstructure
Qualitative Parameters of the Crack Behaviour in Quasi-Real Microstructures
|
Parame-ter |
Sym-bol |
Method of determination |
Physical Meaning |
|
Peak load of the force-displacement curve, N |
Fmax |
maximal force on the force-displacement curve |
critical load at which the crack begins to propagate |
|
Nominal specific energy of the formation of unit new surface, J/m2 |
G |
by the formula: G = Sumi (Pi ui)/ LRS,where Pi – force for each loading step, ui – displacement for each loading step, LRS = 100 mcm - linear size of the real microstructure, the summation is carried out for all loading steps until the crack passes the real microstructure. |
resistance of the material to the crack growth (in relation to the unit of nominal new surface) |
|
Averaged loading force, N |
Fav |
by the formula: Fav = Sumi Pi ui/ um,where um=0.0026 mm, ui – displacement for each loading step, the summation is carried out until u= um. |
the resistance of the material to crack growth (in relation to the applied displacement) |
|
Maximal height of the roughness peak mcm
|
Rmax |
the distance between highest and lowest points of the crack path measured along the perpendicular to the initial (horizontal) crack direction |
the degree of variations of crack path |
Development of the Method of Calculation of Energetic and Fractal Characteristic of Fracture from FE-Simulations
i ~ L0D
,Comparison of Analytical and Numerical Results
| Results of the Analytical and Probabilistic Models | FE-Simulation | G is a power function of D. | The plot of G versus D looks like a power function (with deflections) | D is a linear function of log (Rz). | The plot of Rmax versus D looks as an exponential function | Net-like microstructure (assuming the crack follows the carbide network) ensures maximum fracture resistance, and highest surface roughness | Fine net-like microstructure (in which the crack follows the carbide network) gave the highest G and Rmax values | BUT:
The fracture energy and surface roughness increase with increasing the network cell size in the net-like microstructure |
When the network cell size in the net-like microstructure exceeds some threshold, the crack stops to follow the carbide network |
Conclusions